
Data types
Data Types in Six Sigma: How Choosing the Right Data Transforms Your Improvement Results
Why Many Six Sigma Projects Fail Before They Begin
Most Six Sigma projects don’t fail because teams lack enthusiasm.
They fail quietly, early, and invisibly—because the wrong data is collected, measured incorrectly, or analysed using the wrong method.
Imagine spending weeks collecting data, only to realise later that:
- The data cannot be analysed statistically
- The charts chosen don’t fit the data type
- The conclusions are challenged by stakeholders
- The improvement actions are based on weak evidence
This is not a tools problem.
This is a data literacy problem.
In Six Sigma, data is not just input. It is the foundation on which your Define, Measure, Analyze, Improve, and Control phases stand. If that foundation is weak, everything built on top of it becomes unstable.
Understanding data types is what separates professional problem-solving from guesswork. When teams clearly know what kind of data they are working with, they choose the right charts, the right tests, and the right improvement actions—with confidence.
What Do We Really Mean by “Data” in Six Sigma?
In everyday work, we often say “I have data” when what we really have are scattered numbers, partial records, or subjective observations. In Six Sigma, data has a stricter meaning.
Data is structured information collected using defined rules to describe how a process behaves.
For example:
- The number of defective parts produced per shift
- The time taken to resolve a customer ticket
- The temperature of a machine at different intervals
- Customer satisfaction ratings after a service interaction
Each of these represents a different type of data, and each requires a different method of analysis. Treating them all the same is one of the fastest ways to reach the wrong conclusion.
This is why the first question a Six Sigma professional asks is not:
“How much data do we have?”
But:
“What type of data are we dealing with?”
Quantitative and Qualitative Data: Two Very Different Worlds
At the highest level, Six Sigma data falls into two broad categories: quantitative and qualitative. The difference is more than academic—it determines what analysis is valid.
Quantitative data is numerical. It represents measurable quantities such as time, weight, cost, length, or counts. When you measure cycle time in minutes, defect rate in percentages, or downtime in hours, you are working with quantitative data. This type of data allows deeper statistical analysis. You can calculate averages, variation, trends, correlations, and relationships. Most Six Sigma tools—histograms, control charts, regression—depend on quantitative data.
Qualitative data, on the other hand, describes categories, attributes, or qualities. It answers questions like:
What type of defect is this?
Which department handled this request?
Is the customer satisfied or not?
Qualitative data is extremely valuable for understanding patterns, segmentation, and root cause themes, but it cannot be analysed using the same statistical methods as numerical data. Treating qualitative data like quantitative data—for example, averaging satisfaction categories—creates misleading insights.
Strong Six Sigma projects use both. Qualitative data often helps frame the problem. Quantitative data helps prove the solution.
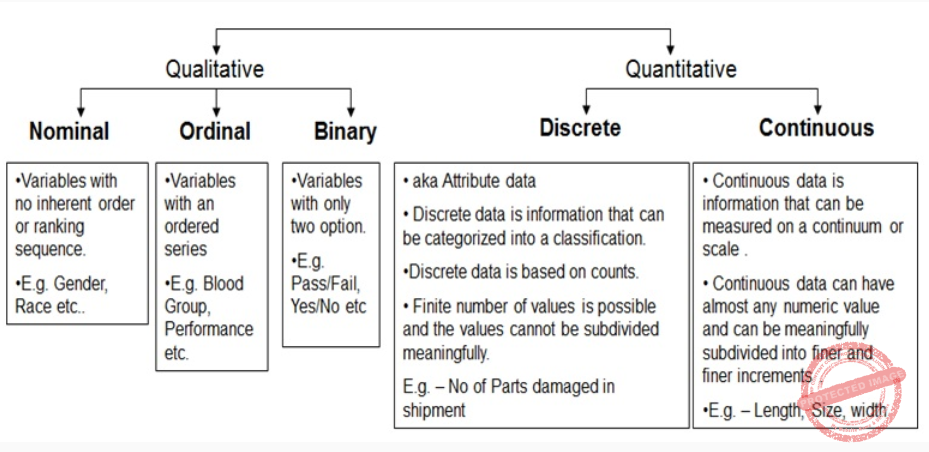
Discrete and Continuous Data: Not All Numbers Behave the Same
Even within quantitative data, not all numbers are equal. Some numbers are counted. Others are measured. This distinction affects everything from chart selection to hypothesis testing.
Discrete data comes from counting. It represents whole numbers and cannot be subdivided meaningfully. You can count the number of defects, the number of calls received, or the number of errors in a report. You cannot have 2.6 defects in a unit—it is either defective or not.
Continuous data comes from measurement. It can take any value within a range. Time taken to process an application can be 3.2 minutes, 3.27 minutes, or 3.271 minutes depending on measurement precision. Temperature, length, speed, and weight are all continuous.
Why does this matter?
Because Six Sigma tools assume certain data behaviours. Control charts for counts differ from control charts for measurements. A histogram of time behaves differently from a histogram of defect counts. Mixing these up leads to incorrect conclusions about stability and performance.
Professionals who master this distinction can immediately spot when a team is using the wrong analysis method.
Understanding Measurement Scales: Nominal, Ordinal, Interval, and Ratio
Beyond data type, Six Sigma professionals also care about measurement scales. This determines what kind of mathematical operations and comparisons are valid.
Nominal data is purely categorical. There is no inherent order. For example, product categories, defect types, or machine IDs. You can count frequency, but you cannot rank or average them.
Ordinal data has a meaningful order but unequal spacing. Customer satisfaction ratings such as “Poor, Average, Good, Excellent” fall into this category. While “Excellent” is better than “Good,” the distance between these categories is not mathematically equal. This means that calculating averages can be misleading.
Interval data has equal spacing between values, but no true zero. Temperature in Celsius is a classic example. The difference between 20°C and 30°C is the same as between 30°C and 40°C, but 0°C does not mean “no temperature.” This affects ratio-based interpretations.
Ratio data has equal spacing and a true zero. Time, weight, cost, and distance fall here. This is the most powerful scale in Six Sigma because all statistical operations are valid.
Understanding these scales prevents one of the most common analytical mistakes: performing mathematically valid calculations on data that does not support them conceptually.
Why Data Type Directly Determines the Tool You Should Use
In Six Sigma, tools are not chosen based on preference—they are chosen based on data type.
When you use a histogram, you assume continuous data.
When you use a p-chart, you assume binary outcomes.
When you use regression, you assume numerical relationships.
When you use a Pareto chart, you assume categorical frequency.
When teams mismatch tools and data, they still get charts—but the charts tell the wrong story. Leaders may approve changes based on misleading analysis, and months later, the process slips back into old behaviour.
Professionals who understand data types don’t just “use tools.”
They choose tools strategically, ensuring every insight is defensible in front of stakeholders, auditors, and leadership.
Real-World Example: How Wrong Data Types Create Wrong Decisions
Consider a service organization trying to improve customer satisfaction. The team collects feedback using a 5-point rating scale and calculates the average score. They celebrate when the average moves from 3.6 to 3.8.
What they miss is that satisfaction ratings are ordinal data. The difference between “Satisfied” and “Very Satisfied” is not equal to the difference between “Neutral” and “Satisfied.” The average hides distribution changes. The correct approach would examine proportions in each category and segment by customer type or service channel.
By understanding data types, the team could shift from cosmetic improvement to meaningful change—such as reducing the proportion of dissatisfied customers rather than chasing average scores.
How ICEQBS Builds Practical Data Thinking (Not Just Tool Usage)
Many training programs teach Six Sigma tools in isolation. ICEQBS focuses on building data thinking.
Learners are trained to:
- Identify the correct data type before analysis
- Design measurement systems that produce reliable data
- Choose charts and tests based on data behaviour
- Defend insights with statistical and logical rigor
- Translate data into decisions leaders trust
This prevents “analysis for presentation” and replaces it with analysis for impact. When professionals graduate from ICEQBS programs, they don’t just know how to draw charts—they know why a particular chart is the right one for a given problem.
Final Thought: Data Types Are Not Theory — They Are Strategy
Understanding data types may seem basic, but it is one of the most strategic skills in Six Sigma. It determines:
- Whether your problem definition is credible
- Whether your root cause analysis stands up to scrutiny
- Whether your improvements sustain
- Whether leaders trust your recommendations
In a world overflowing with dashboards and metrics, professionals who understand what kind of data they are actually looking at stand out. They make fewer mistakes, argue with evidence, and drive changes that last.
If you want your Six Sigma projects to deliver real business results—not just charts and presentations—build strong data foundations with ICEQBS.
👉 Learn how to classify data correctly
👉 Choose the right tools for the right data
👉 Turn measurements into confident decisions
ICEQBS – Where Data Becomes Direction.
#DataTypes #SixSigma #LeanSixSigma #QuantitativeData #QualitativeData #DiscreteData #ContinuousData #StatisticalAnalysis #DataDriven #QualityManagement #ProcessImprovement #BusinessAnalytics #OperationalExcellence #DMAIC #Analytics #DataClassification #MeasurementSystems #StatisticalThinking #QualityImprovement #LeanManagement